Turning Heat Into Insight for Industrial Reliability
Infrared thermography turns heat into information. By looking at temperature patterns instead of just waiting for alarms or failures, maintenance teams can see problems forming long before they shut a line down. For industrial plants that depend on motors, hoists, controls, and reliable power, this can be the difference between a planned stop and a long, expensive outage.
As production ramps up in late spring and ambient temperatures rise, electrical and mechanical stress also climb. Load climbs, cooling margins shrink, and weak points start to show. This is when a structured industrial infrared thermography program becomes especially valuable, because it exposes hidden issues that standard visual inspections miss. In this article, we explain how the technology works, where it delivers the most value, how to design a repeatable program, and how expert partners turn thermal images into real gains in uptime and asset life.
How Infrared Thermography Strengthens Predictive Maintenance
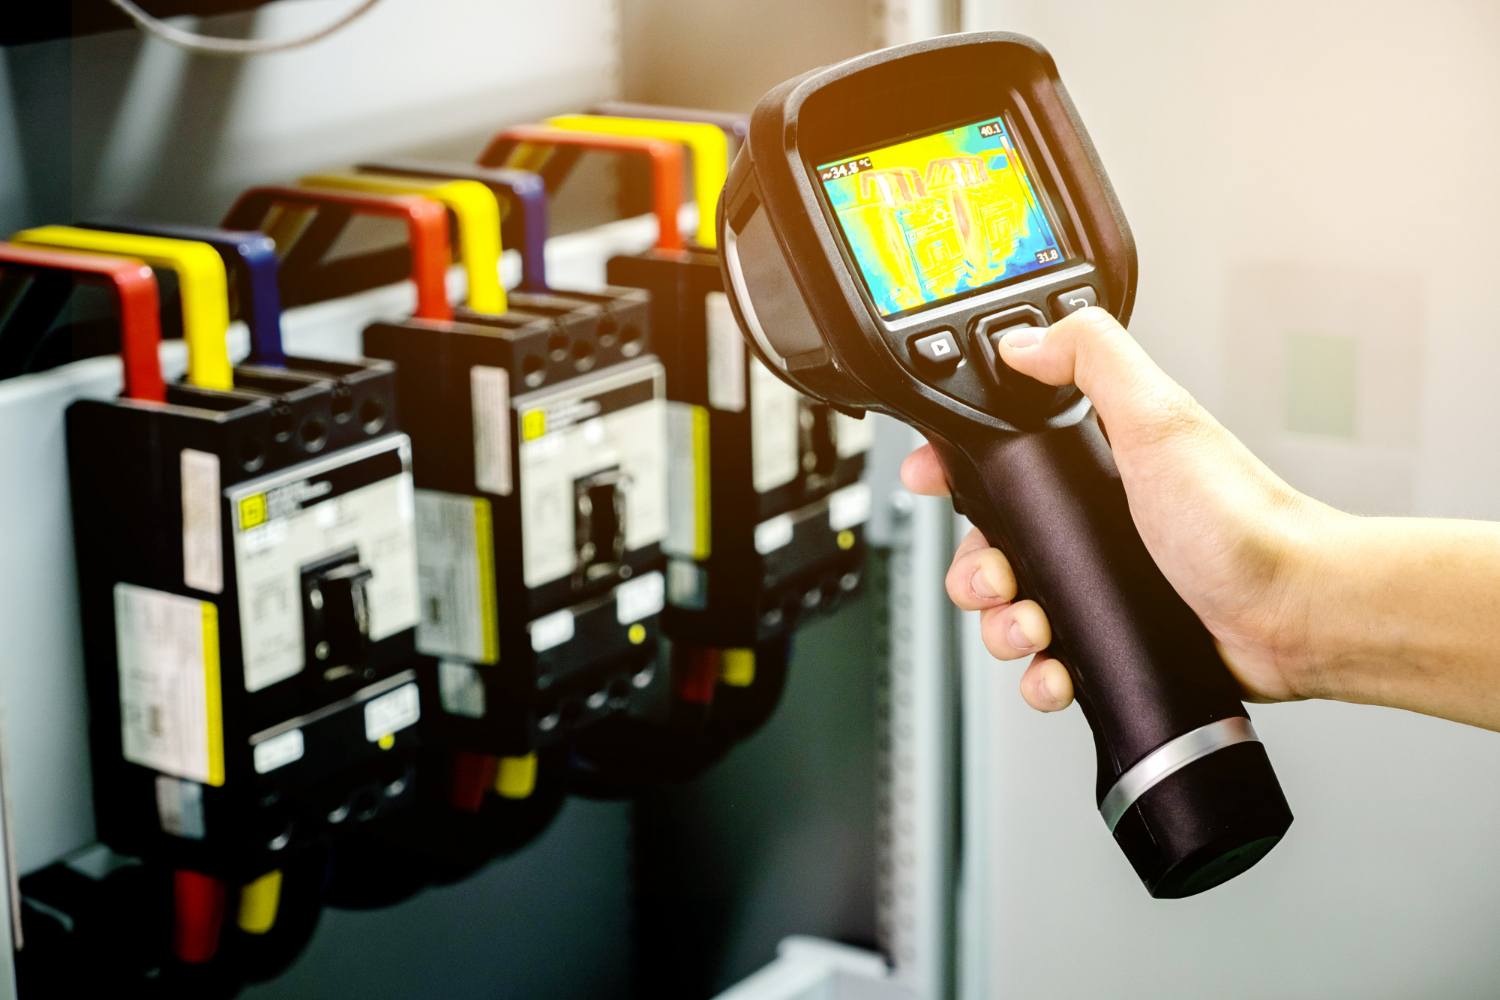
Infrared thermography is based on a simple technical idea. Every object above absolute zero emits infrared radiation. An infrared camera detects this radiation and converts it into a thermal image, where different colors or shades represent different temperatures. When equipment is operating, abnormal heat often points to abnormal conditions.
For industrial assets, heat patterns can indicate issues such as:
- High electrical resistance from loose or corroded terminations
- Unbalanced or overloaded phases in power circuits
- Excess friction from failing bearings or poor lubrication
- Insulation breakdown in motor windings or power cables
Within a predictive maintenance strategy, industrial infrared thermography supports condition-based decisions instead of calendar-based guesses. It fits alongside vibration analysis, motor circuit testing, and oil analysis. Each tool sees a different part of equipment health, and together they give a more complete picture.
Early identification of hot spots allows teams to:
- Intervene before damage spreads to windings, shafts, or conductors
- Reduce emergency repairs and unplanned overtime
- Protect critical motors and hoists that support production bottlenecks
- Improve mean time between failures for key lines and cranes
Thermal imaging is non-contact and non-invasive, so most assets can be scanned while energized and under load. That real-world operating view is where many hidden problems show up first.
Pinpointing Failures Before Summer Peaks Hit
By mid-May, many facilities are preparing for higher production and higher ambient temperatures. Higher heat makes marginal equipment less forgiving. Terminations that were only slightly loose in cool weather may start to run far above acceptable limits when load and room temperature climb.
Common thermal findings during this period include:
- Overloaded or imbalanced circuits in panelboards and switchgear
- Loose or oxidized terminations in motor control centers
- Overheating motor windings caused by insulation stress or poor cooling airflow
- Undersized conductors and cables running hotter than expected under seasonal loads
- Hoist brake and drive components operating at temperatures above their normal range
Scheduling industrial infrared thermography surveys before peak summer loads gives maintenance teams a head start. Findings can be ranked by severity and production risk. Corrective actions may range from tightening and cleaning terminations to planning motor rewinds, hoist brake overhauls, or control upgrades during existing planned shutdowns.
Instead of reacting to summer failures, plants can enter the high-demand season with a prioritized repair list based on real thermal data.
Priority Assets and Use Cases for Thermal Inspections
Not every asset has the same risk profile. Focusing thermal inspections on high-impact equipment gives the best return on effort and time.
High-value electrical inspection targets include:
- Low- and medium-voltage switchgear and main breakers
- Panelboards and bus ducts feeding critical production lines
- Motor control centers, VFDs, and soft starters
- Motor junction boxes and terminal connections
- Hoist control cabinets and crane electrification systems
- Large power transformers and distribution equipment
Mechanical applications are just as important. Abnormal heat in rotating or moving components can point to:
- Bearing distress from wear, contamination, or poor lubrication
- Misalignment between motors and driven equipment
- Over-tensioned belts or chain drives creating extra friction
- Overheated components on overhead cranes and hoists
The key is turning findings into clear actions. For example, thermal results may lead teams to:
- Rebalance electrical loads across phases or panels
- Correct torque and alignment on motors driving high-value lines
- Modernize obsolete controls that show recurring hot spots
- Pull tested spares from surplus inventories to replace overheating components before failure
With structured reporting, each hot spot becomes a work order, not a vague concern.
Designing a Repeatable Infrared Inspection Program
One-off surveys can help, but real reliability gains come from a repeatable program. That starts with standard inspection routes that match the facility’s process and risk profile. Routes should include:
- Critical production lines and bottleneck assets
- Safety-related systems such as hoists, cranes, and emergency power
- Assets with a history of frequent failures or elevated temperatures
- Equipment in harsh zones such as high ambient heat, dust, or corrosive areas
Best practices for program design include:
- Defining temperature thresholds and alarm criteria for each asset class
- Normalizing findings for ambient conditions and load at the time of inspection
- Capturing baseline images when systems are known to be healthy
- Comparing year over year or season over season images to spot trends
- Feeding results into a CMMS so work orders and history are tied to each asset
Inspection frequency should reflect asset criticality and environment. Highly loaded switchgear in a hot, dusty area may need more frequent scans than lightly loaded distribution panels in a clean, conditioned space. OEM guidance can help set starting intervals, which can then be adjusted based on experience and findings.
When industrial infrared thermography is treated as a core element of predictive maintenance, not a one-time project, it becomes part of how the plant manages risk every day.
Turning Thermal Data Into Measurable Reliability Gains
Thermal images may look visual and qualitative, but they can be translated into clear reliability outcomes. Each inspection cycle should result in ranked findings, recommended actions, and target completion dates.
Over time, plants can track how thermal programs affect:
- Unplanned outages linked to electrical or mechanical failures
- Emergency call-outs and after-hours repair events
- Scrap, rework, and quality issues tied to intermittent power or control problems
- Repeat failures on the same assets or circuits
Cross-functional collaboration is important. Maintenance, reliability engineering, production, and safety teams should review thermal reports together. This helps align priorities so that repairs with the highest production impact or safety concern move to the top of the list.
Structured reporting from industrial infrared thermography supports broader decisions as well. Repeated hot spots on aging motor control centers, for example, can support capital planning for modernization. Recurring thermal issues in hoists or cranes can guide lifecycle strategies for those assets.
At Zeller Technologies, we see infrared thermography as one part of a complete reliability toolkit. By combining thermal findings with our motor, hoist, and control repair and modernization services, along with predictive maintenance support and surplus parts, we help industrial customers across the central United States act quickly on what the images reveal. When heat data is tied to expert diagnostics and timely corrective work, plants gain not just images but real improvements in uptime, safety, and asset longevity.
Optimize Reliability With Data-Driven Thermal Insights
Leverage our expertise in industrial infrared thermography to detect issues early and keep your critical assets running at peak performance. At Zeller Technologies, we work with your team to turn thermal data into clear maintenance priorities and actionable next steps. If you are ready to reduce downtime and improve safety, contact us and we will help you define the right approach for your facilities.